본문으로 바로가기
Total Fertility Rate and Old-Age Dependency Ratio
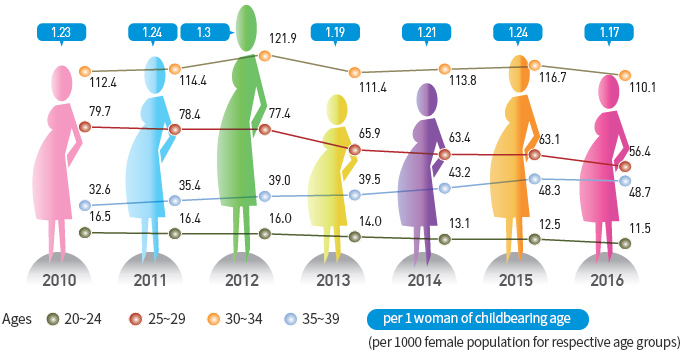
- In 2016, the total fertility rate hit 1.17, which is a year-on-year decline of 0.07 and below the replacement level of 2.1.
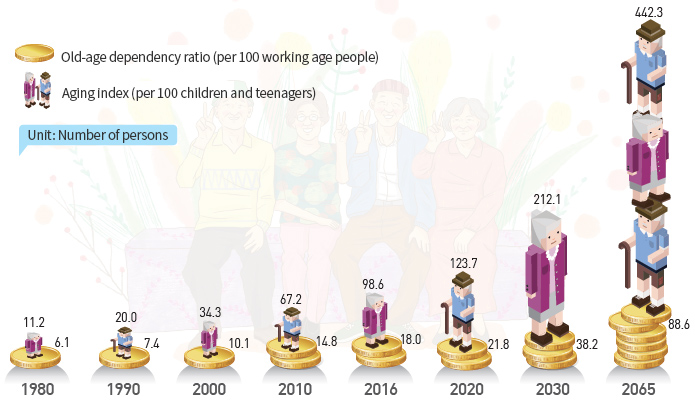
- Owing to the rapidly rising number of aged population, the old-age dependency ratio is expected to surpass 30 in 2030 and reach 88.6 in 2065, which is 4.9 times higher than the 2016 level of 18.
Total Fertility Rate and Age-Specific Fertility Rate (2010-2016)
Total Fertility Rate and Age-Specific Fertility Rate
| Ages |
2010 |
2011 |
2012 |
2013 |
2014 |
2015 |
2016 |
| 20~24 |
16.5 |
16.4 |
16.0 |
14.0 |
13.1 |
12.5 |
11.5 |
| 25~29 |
79.7 |
78.4 |
77.4 |
65.9 |
63.4 |
63.1 |
56.4 |
| 30~34 |
112.4 |
114.4 |
121.9 |
111.4 |
113.8 |
116.7 |
110.1 |
| 35~39 |
32.6 |
35.4 |
39.0 |
39.5 |
43.2 |
48.3 |
48.7 |
| Total |
1.23 |
1.24 |
1.3 |
1.19 |
1.21 |
1.24 |
1.17 |
per 1 woman of childbearing age(per 1000 female population for respective age groups)
Old-Age Dependency Ratio and Aging Index(1980-2065)
Old-Age Dependency Ratio and Aging Index(1980-2065)
| caetgory |
1980 |
1990 |
2000 |
2010 |
2016 |
2020 |
2030 |
2065 |
| old-age dependency ratio(pre 100 working age people) |
6.1 |
7.4 |
10.1 |
14.8 |
18.0 |
21.8 |
38.2 |
88.6 |
| Aging index(pre 100 children and teenagers) |
11.2 |
20.0 |
34.3 |
67.2 |
98.6 |
123.7 |
212.1 |
442.3 |