Health Statistics
Number of Licensed Medical Personnel and Employed Health Care Providers
- In 2016, the number of licensed medical personnel increased 2.4% to 118,696, compared to the 2015 level. Among them, dentists accounted for 29,632 (up 2.4%), Traditional Korean Medicine Doctors 23,845 (up 2.9%), pharmacists 66,992 (up 2.3%), and nurses 355,772 (up 5.1%).
- In 2016, the number of employed health care providers reached 621,189, which indicates an annual average growth of 9.1% since 2010. Among them, 56.3% work in hospitals, 41.3% in clinics and maternity centers, and 2.4% in public health centers.
Trends in Licensed Medical Personnel(2000-2016)
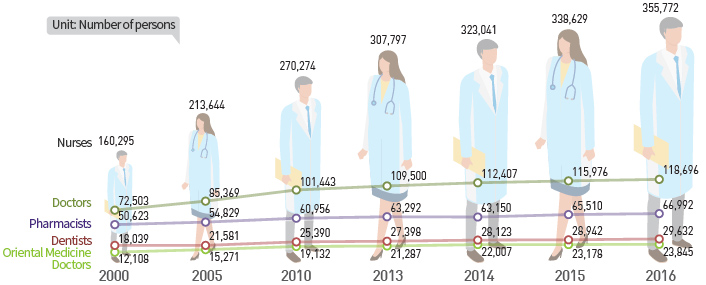
Unit:Number of persons
| category | 2000 | 2005 | 2010 | 2013 | 2014 | 2015 | 2016 |
|---|---|---|---|---|---|---|---|
| Doctors Oriental Medicine | 12,108 | 15,271 | 19,132 | 21,287 | 22,007 | 23,178 | 23,845 |
| Dentists | 18,039 | 21,581 | 25,390 | 27,398 | 28,123 | 28,942 | 29,632 |
| Pharmacists | 50,623 | 54,829 | 60,956 | 63,292 | 63,150 | 65,510 | 66,992 |
| Doctors | 72,503 | 85,369 | 101,443 | 109,500 | 112,407 | 115,976 | 118,696 |
| Nurses | 160,295 | 213,644 | 270,274 | 307,797 | 323,041 | 338,629 | 355,772 |
Trends in the Number of Health Care Providers(2010, 2016)
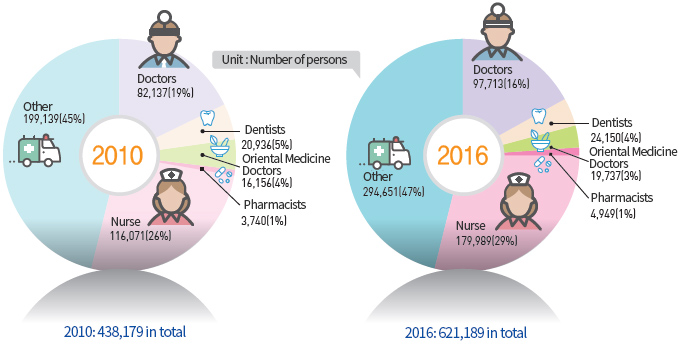
2010
Unit:Number of persons
| Doctors | Dentists | Oriental Medicine Doctors | Pharmacists | Nurse | Other |
|---|---|---|---|---|---|
| 82,137(19%) | 20,936(5%) | 16,156(4%) | 3,740(1%) | 116,071(26%) | 199,139(45%) |
2010 : 438,179 in total
2016| Doctors | Dentists | Oriental Medicine Doctors | Pharmacists | Nurse | Other |
|---|---|---|---|---|---|
| 97,7132(16%) | 24,150(4%) | 19,737(3%) | 4,949(1%) | 179,989(29%) | 294,651(47%) |
2016:621,189 in total