Health Statistics
Status of Childcare and ECEC Teachers
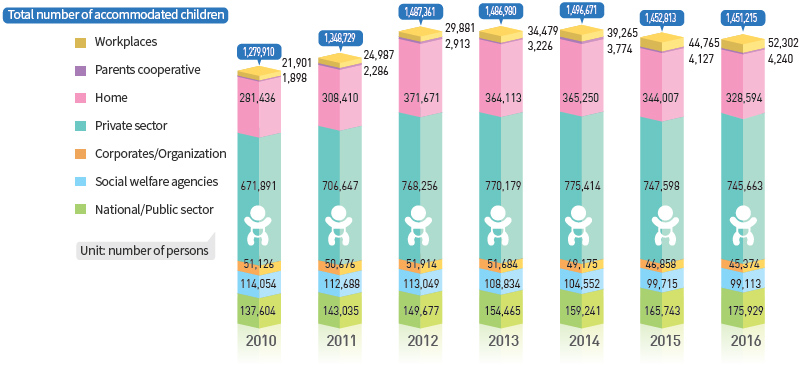
- By the end of 2016, the number of children enrolled in childcare facilities declined to 1.451 million, which indicates a year-on-year decrease of 0.1%.
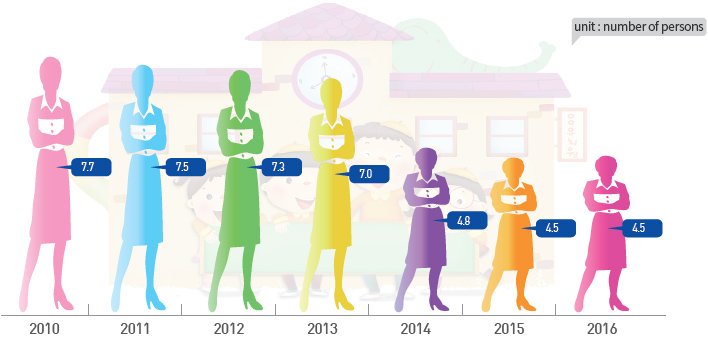
- During the same period, the number of ECEC teachers went up to 322,000, an increase of 0.2% from the previous year.
- The number of children per ECEC teacher remains the same as last year at about 4.5.
Number of children per facility(2010-2016)
Unit : number of persons
| category | 2010 | 2011 | 2012 | 2013 | 2014 | 2015 | 2016 |
|---|---|---|---|---|---|---|---|
| Total number of accommodated children | 1,279,910 | 1,348,729 | 1,487,361 | 1,486,980 | 1,496,671 | 1,452,831 | 1,451,215 |
| Workplaces | 21,901 | 24,987 | 29,881 | 34,479 | 39,265 | 44,765 | 52,302 |
| Parents cooperative | 1,898 | 2,286 | 2,913 | 3,226 | 3,774 | 4,127 | 4,240 |
| Home | 281,436 | 308,410 | 371,671 | 364,113 | 365,250 | 344,007 | 328,594 |
| Private sector | 671,891 | 706,647 | 768,256 | 770,179 | 775,414 | 747,598 | 745,663 |
| Corporates/Organization | 51,126 | 50,676 | 51,914 | 51,684 | 49,175 | 46,858 | 45,374 |
| Social welfare agencies | 114,054 | 112,688 | 113,049 | 108,834 | 104,552 | 99,715 | 99,113 |
| National/Public sector | 137,604 | 143,035 | 149,677 | 154,465 | 159,241 | 165,743 | 175,929 |
Number of children per child care teacher(2010-2016)
Unit : number of persons
| 2010 | 2011 | 2012 | 2013 | 2014 | 2015 | 2016 |
|---|---|---|---|---|---|---|
| 7.7 | 7.5 | 7.3 | 7.0 | 4.8 | 4.5 | 4.5 |