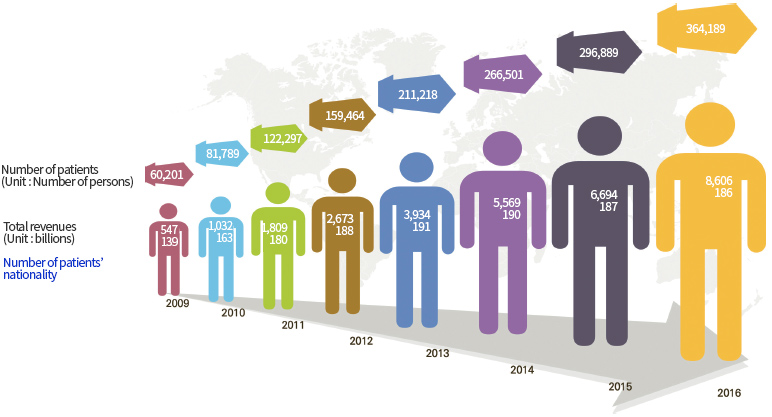
- In 2016, the total number of inbound international patients climbed to 364,189, which represents a year-on-year increase of 22.7% (an annual average growth of 29.3%).
- The total revenues from international patient care rose to KRW 860.6 billion in 2016, which represents a year-on-year increase of 28.6% (an annual average growth of 48.2%).
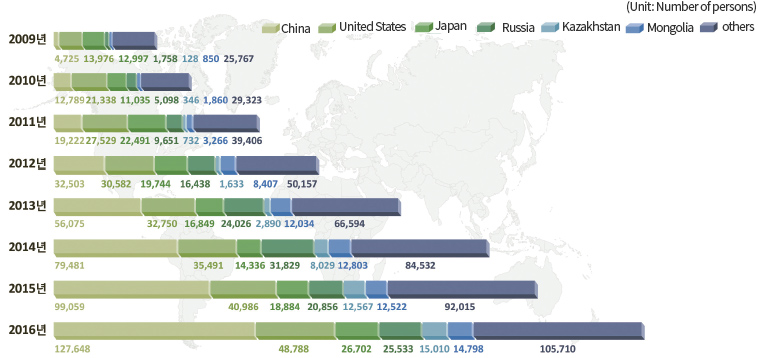
- Chinese patients account for 35% of all inbound international patients to Korea, ranking China as the top sending country since 2012.
Trends in Inbound International Patients(2009-2016)
Trends in Inbound International Patients (2009-2016)
| category |
2009 |
2010 |
2011 |
2012 |
2013 |
2014 |
2015 |
2016 |
| Number of patients(unit:Number of persons) |
60,201 |
81,789 |
122,297 |
159,464 |
211,218 |
266,501 |
296,889 |
364,189 |
| Tatal revenues(Unit : billions) |
547 |
1,032 |
1,809 |
2,673 |
3,934 |
5,569 |
6,694 |
8,606 |
| Number of patients' nationality |
139 |
163 |
188 |
191 |
190 |
187 |
187 |
186 |
Trends in Nationality of Inbound International Patients(2009-2016)
unit : Numnber of persons
Trends in Nationality of Inbound International Patients(2009-2016)
| category |
2009 |
2010 |
2011 |
2012 |
2013 |
2014 |
2015 |
2016 |
| China |
4,725 |
12,789 |
19,222 |
32,503 |
56,075 |
79,481 |
99,059 |
127,648 |
| United States |
13,976 |
21,338 |
27,529 |
30,582 |
32,750 |
35,491 |
40,986 |
48,788 |
| Japan |
12,997 |
11,035 |
22,491 |
19,744 |
16,849 |
14,336 |
18,884 |
26,702 |
| Russia |
1,758 |
5,098 |
9,651 |
16,438 |
24,026 |
31,829 |
20,856 |
25,533 |
| Kazakhstan |
128 |
346 |
732 |
1,633 |
2,890 |
8,029 |
12,567 |
15,010 |
| Mongolia |
850 |
1,860 |
3,266 |
8,407 |
12,034 |
12,803 |
12,522 |
14,798 |
| Others |
25,767 |
29,323 |
39,406 |
50,157 |
66,594 |
84,532 |
92,015 |
105,710 |

